Article
A Drowning Risk We Do Not Talk About Enough: Overseas-Born Australians
New analysis from Aquatots shows that overseas-born Australians are at a higher risk of drowning. With National Water Safety Day on December 1, 2025, we need to ask: Are we reaching the communities at the highest risk?
Key findings
- Over the last
20 years, people born overseas have often made up a
bigger share of drowning deaths than their share of the population. In the late 2010s, they were about
30% of the population but up to
40% of drowning deaths.
- In the five years before COVID
(2015-16 to 2019-20), overseas-born Australians drowned at a rate about
25% higher than the overall population. This occurred while the national drowning rate improved. It suggests that overseas-born communities did not benefit as much as those born in Australia.
- From
2005-06 to 2023-24, there were
1,627 drowning deaths among people born overseas - over
30% of all drowning deaths in that period.
- From 2013-14 to 2022-23, the average annual drowning rate was 1.04 deaths per 100,000 for Australian-born residents. For overseas-born residents, it was 1.30. For Nepal-born people, it was 2.48, and for China-born people, it was 1.98.
Australia loves water, but not everyone is equally safe. Our analysis of 20 years of drowning data shows a clear pattern. People born overseas are often carrying more than their share of the grief.
Chart 1
Chart 1 shows how the picture has changed over time.
In the mid-2000s, overseas-born residents were about a quarter of the population. They were also about a quarter of drowning deaths.
Over time, that changed. By the late 2010s, people born overseas made up roughly 30% of Australia’s population. But in some years, they accounted for around 40% of drowning deaths.
A five-year bracket analysis highlights this shift (2024-25 excluded, overseas-born drowning data is provisional):
- 2005-06 to 2009-10: overseas-born people were about 27% of drowning deaths.
- 2010-11 to 2014-15: overseas-born people’s share rose to about 29%.
- 2015-16 to 2019-20: it jumped to over 36%, more than one in three deaths.
- 2020-21 to 2023-24: the share sits at about 29%.
This raises an important question. Is this simply due to the growth of the overseas-born population, or are overseas-born Australians actually less safe in the water?
To answer this question, we look at deaths per 100,000 people per year, the crude annual drowning rate. For much of the last 20 years, the rate for people born overseas has sat above the rate for the population as a whole (see chart 2).
Chart 2
In the five years before COVID (2015–16 to 2019–20), the drowning rate for overseas-born Australians was about 25% higher than the national average. In some of those years, the ‘extra risk’ climbed close to 40%.
For most of the period, the risk ratio (shown by the yellow dashed line in Chart 2) is at or above 1.0. This means overseas-born Australians were as likely, and often more likely, to drown than the average Australian.
Since COVID, the two lines have moved closer together. Overall drowning has gone up, and the gap between overseas-born and Australian-born has narrowed. But the long-term story is clear; for many years, overseas-born Australians - including many culturally and linguistically diverse (CALD) communities were more likely to die once they entered the water.
The CALD communities cover many different communities. We focused on three large migrant communities: people born in China, India, and Nepal.
In 2005, the Nepal-born population in Australia was about 3,800. By 2024, it was around 197,800, more than 50 times larger. Over the same period, the India-born population grew by more than fivefold, and the China-born population by more than threefold.
We used ten years of Royal Life Saving National Fatal Drowning Database Dashboard data (2013-14 to 2022-23) and population figures from the Australian Bureau of Statistics. We calculated average annual drowning rates per 100,000 people and compared different groups (see chart 3).
Chart 3
Two things stand out from chart 3:
- People born in Nepal and China seem to have a higher risk of drowning. This risk is greater than the average for those born overseas and for the Australian-born population.
- People born in India have a lower crude rate, but India and Nepal together still account for around seven drowning deaths a year on average.
Across this time period
(2013-14 to 2022-23), there were
933 drowning deaths
among people born overseas.
181
of these involved people born in
China, India, or Nepal, almost one in five overseas-born drowning deaths.
What this means for a drowning-free Australia
This study doesn’t explain all the reasons for the numbers. But it clearly shows that if Australia aims to reduce drowning deaths by half, CALD communities need to be included.
We know that overseas-born Australians face a higher drowning risk, it's time for specific action:
- Make swimming lessons more affordable and culturally safe.
- Offer water safety information in multiple languages.
- Listen to CALD communities about the barriers they face and the support they need.
Recognizing these patterns and admitting the gaps is the first step to real progress. It’s key to a drowning-free nation where no family is left behind.
Methodology & Data Notes
Data Sources
- NATIONAL DROWNING REPORT, Royal Life Saving Australia, several years
- Royal Life Saving National Fatal Drowning Database Dashboard
- 34090DO001_2024 Australia's population by country of birth 2024, Estimated resident population by country of birth - as at 30 June, 1996 to 2024, Released at 11:30 am (Canberra time) 30 April 2025, Australian Bureau of Statistics
- A 10 YEAR NATIONAL STUDY OF OVERSEAS BORN DROWNING DEATHS, 2005/06 to 2014/15, Royal Life Saving Australia
- Drowning Among Multicultural Communities in Australia, AN UPDATE: 2013/14 TO 2022/23, Royal Life Saving Australia
Formula
- Crude drowning rate
(raw death count in the year/population of the year) * 100,000
- Risk Ratio
Overseas-born drowning rate/Australian-born drowning rate
A value above 1 means overseas-born Australians face higher drowning risk.
Note
- 'Overseas-born' is not the same as 'CALD', our analysis focuses on country of birth
- We used the Royal Life Saving National Fatal Drowning Database Dashboard to analyse the annual total drowning death counts. The dashboard reports 316 deaths for the 2023-24 period. National Drowning Report 2024, Royal Life Saving Australia shows 323. The difference does not affect any trend or conclusion in the analysis.
Using our work
Aquatots Research & Data Team's work is meant to be shared and used widely. You do not need to seek our permission to reuse our article, charts, data, you just need to provide credit - http://www.aquatots.com.au/a-drowning-risk-we-do-not-talk-about-enough:-overseas-born-australians
About Aquatots

Around this time of year most schools will have swim lessons as part of their curriculum. At Aquatots we commend school swim programs as every child should have the right to learn this life saving skill. The more chances we can expose children to an aquatic environment and give them access to lessons the safer our children will be.
We do feel it is important that parents understand what school swim classes are about as sometimes parents feel they should choose between regular classes and school classes.
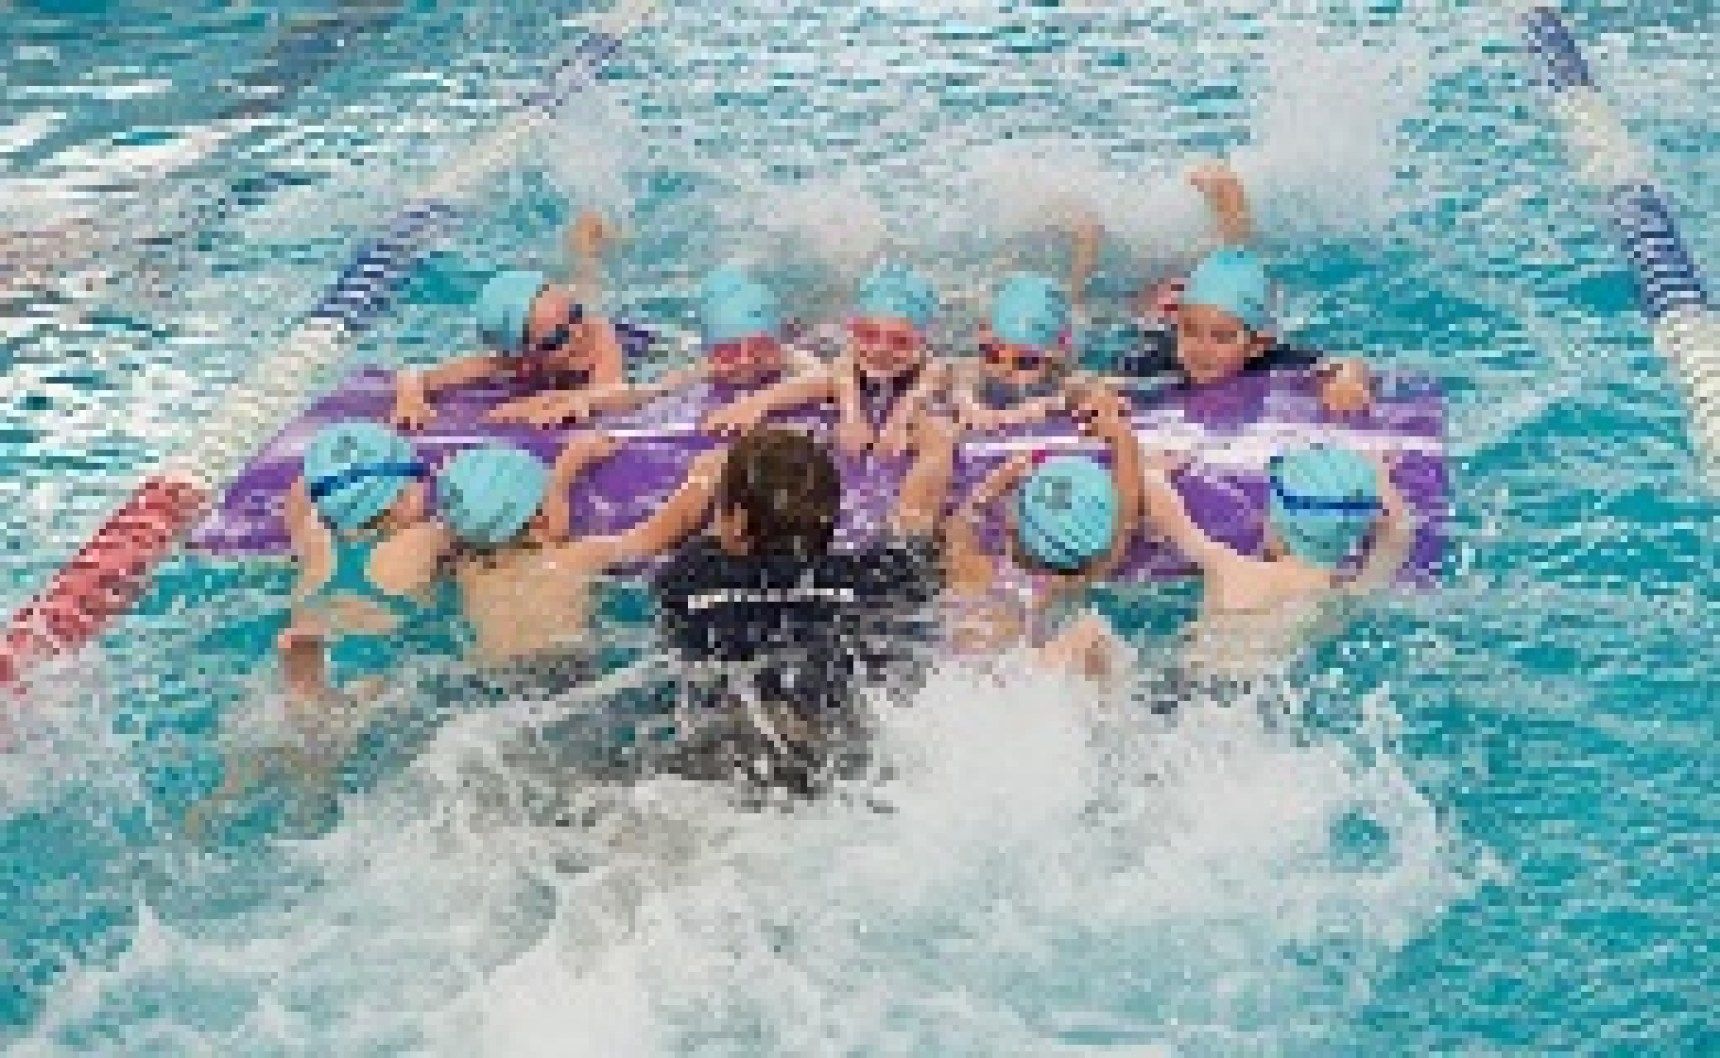
School swim programs will see large numbers of children in the one class. At Aquatots the maximum of Kindy classes is 6 kids to one instructor and the other years have 8 kids per one instructor. Aquatots school classes are considered small compared to many other school swim programs.
Children in the school programs will have the chance to practice their swimming which is great but most of the time they will not get the individual attention to detail they would have in their regular swim class. A quicker progression is usually due to physical corrections made by instructors to help imprint muscle memory. In the larger groups it is hard to make the focus o individual technique.
Attending school swim classes is extremely exciting for children as they are out of school, they are with their friends and there are no parents to watch their class. In some instances children will be busy having fun with their friends instead of really focusing on what is required from them.
Most schools want to do their swim program in a two week block. This usually means children will get a different instructor each day. This method also takes it toll on kids and school teachers as it is exhausting for them. Two weeks done in one block can see some progression but by the time the children settle the program is over. The skills learnt do not retain once they have finished unless there is continuation of practice. Programs that run once a week over the 10 weeks of the term will see more consistent instructors to the classes and the children have a chance o settle into a routine making the learning process easier for them.
Children attending both regular swim classes and schools programs will see a quicker progression as practice time is bumped up per week. More water time and more lessons per week will equal a fast progression for your child. Keeping your child in their regular classes will also mean that your child retains their position in the program for when they are ready to return to regular classes.


